


POINTCLOUDDEVIATION command
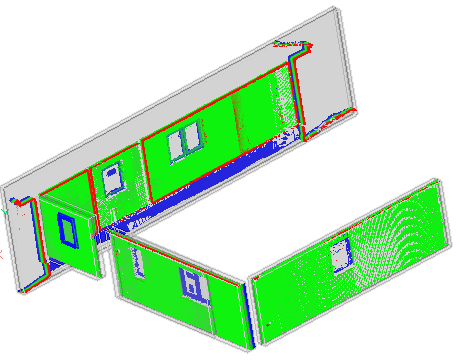
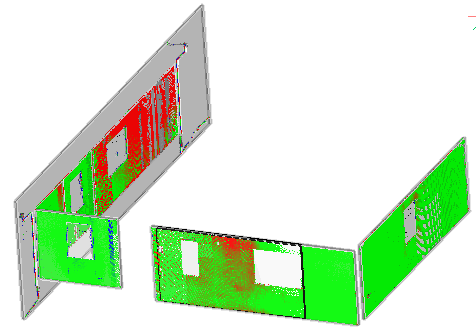
Identifies and visually transposes the closeness of fit of point cloud points with respect to their closest selected planar (sub)entity or TIN surface.

Icon: 
Method
Assigns colors to point cloud points to visualize their closeness of fit with respect to the closest selected planar (sub)entity or TIN surface. The selected entities are isolated using crops while the Command Context panel is open.
After selecting the planar surface, TIN surface or the solid to compare the point cloud to, the Point Cloud Deviation Command Context panel opens to let you easily change the settings.
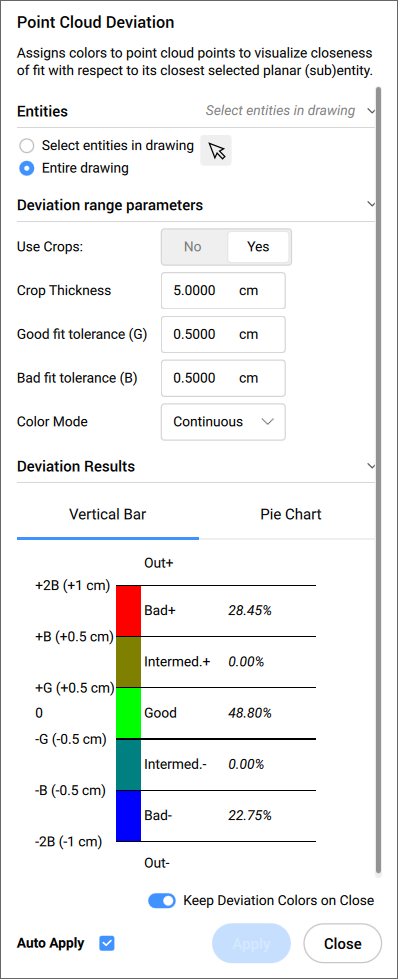
Options within the command context panel
- Entities
-
- Select entities in the drawing
- Selects specific geometric entities in the drawing.
- Entire drawing
- Selects all geometric entities in the drawing.
- Deviation range parameters
-
Note: Parameters previously set by the user are remembered.
- Use Crops
- Toggles the crop of the solids.Note: This option is available only when the input entity is a solid.
- Crop Thickness
- Defines the thickness of a solid that is used around the geometry as a reference for proximity analysis.Note: This option is available only when the input entity is a solid.
- Good fit tolerance (G)
- Sets the good fit (OK) tolerance value.
- Bad fit tolerance (B):
- Sets the bad fit (warning) tolerance value.
- Color Mode
-
- Continuous
- Spreads colors continuously
- Deviation Results
- Displays the point cloud distribution in percentage and colors. You can switch between the Vertical Bar and Pie Chart tabs to visualise the percentages.
-
- Keep Deviation Colors on Close
- Toggles the visualisation of the point cloud distribution in colors after closing the panel.
- Auto Apply
- Automatically applies the changes made in the Command Context panel.
Note: The options within the Command Context panel reflect the options within the command line.