


Ogólna procedura drukowania
Polecenia KREŚL i DRUKUJ umożliwiają drukowanie rysunków na drukarkach i w plikach za pomocą okna dialogowego Drukuj.
Polecenie -KREŚL wykreśla rysunki na drukarkach i w plikach za pomocą podpowiedzi na pasku poleceń; polecenie to jest przeznaczone dla skryptów i procedur.
Polecenie SDRUK drukuje rysunek z domyślną konfiguracją wykresu, bez wyświetlania okna dialogowego Drukuj.
Polecenie USTAWIENIASTR tworzy i edytuje ustawienia stron dla kreślenia rysunków w oknie dialogowym Eksploratora rysunków.
Standardowa procedura drukowania składa się z następujących kroków:
- Wybierz kartę Arkusz lub Model.
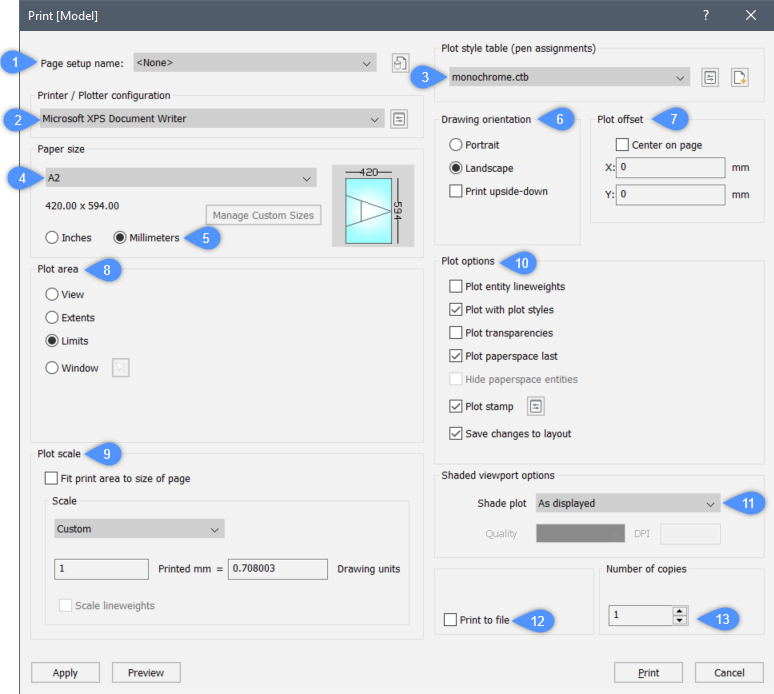
- Otwórz okno dialogowe Drukuj.
- Wybierz nazwę konfiguracji strony. (1)
Poniższe kroki są opcjonalne i konieczne tylko wtedy, gdy chcesz użyć nadpisań w wybranej definicji konfiguracji strony:
- Wybierz konfigurację drukarki lub plotera. (2)
- Wybierz tabelę w stylu wydruku. (3)
- Wybierz rozmiar papieru. (4)
Obraz odzwierciedla położenie i orientację rysunku na wybranym rozmiarze papieru.
- Wybierz rozmiar papieru. (5)
- Wybierz Orientację rysunku.(6)
- Zdefiniuj odsunięcie wydruku. (7)
- Określ obszar wydruku (obszar do wydruku). (8)
- Zdefiniuj Skalę wydruku. (9)
- Sprawdź opcje wydruku. (10)
- Podczas drukowania przestrzeni modelu należy wybrać tryb cieniowania. (11)
Ta opcja jest wyłączona podczas drukowania układu miejsca na papierze.
- Zaznacz/odznacz opcję Drukuj do pliku. (12)
- Określ liczbę kopii. (13)
- Kliknij przycisk Podgląd, aby wyświetlić podgląd danych wyjściowych wydruku.
- W układzie kliknij przycisk Zastosuj, aby zaktualizować arkusz.
- Kliknij przycisk Drukuj, aby rozpocząć drukowanie.
- W systemach macOS i Linux nie jest możliwe drukowanie na drukarkach systemowych. Drukowanie jest możliwe tylko na drukarce Drukuj jako PDF.pc3 . W ten sposób zostanie wygenerowany dokument PDF, który należy wysłać do drukarki w celu fizycznego wydrukowania.
- W systemach macOS i Linux dostępne jest odpowiednie polecenie USTAWIENIASTR.
Otwieranie okna dialogowego Drukuj

Wykonaj jedną z następujących czynności:
- Uruchom polecenie DRUKUJ lub KREŚL.
- Naciśnij Ctrl + P.
- Wybierz polecenie Drukuj... z menu Plik.
- Kliknij narzędzie Drukuj... w obszarze (obszar roboczy Rysowania).
- Wybierz kartę Model lub kartę Arkusz, a następnie kliknij prawym przyciskiem myszy i wybierz polecenie Drukuj z menu kontekstowego.
Wybór rozmiaru papieru
Naciśnij strzałkę w dół, a następnie wybierz rozmiar papieru z listy Rozmiar papieru.
Dostępne rozmiary zależą od wybranej drukarki.
Wybór jednostki papieru
Wybierz cale lub milimetry.
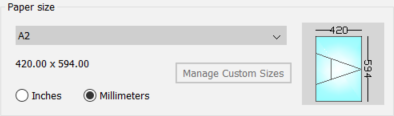
Obraz rozmiaru papieru wskazuje rozmiar, położenie i orientację obszaru wydruku na wybranym rozmiarze papieru.
Wybór orientacji papieru
Wybierz opcję Pionowo lub Poziomo.
- Pionowo: Oś X rysunku lub arkusza jest wyrównana z najkrótszą krawędzią wybranego rozmiaru papieru.
- Poziomo: Oś X rysunku lub arkusza jest wyrównana z najdłuższą krawędzią wybranego rozmiaru papieru.
Obraz rozmiaru papieru zmieni się odpowiednio.
W układzie kliknij przycisk Zastosuj, aby zaktualizować ekran.
Definiowanie odsunięcia wydruku
Wybierz opcję Wyśrodkuj na stronie lub wpisz przesunięcie w polach X: i Y:.
Odsunięcie jest obliczane od lewego dolnego rogu papieru.
W układzie kliknij przycisk Zastosuj, aby zaktualizować ekran.
Aby określić obszar wydruku:
| Opcja | Wynik |
|---|---|
| Podgląd | Drukuje część rysunku, która jest wyświetlana w bieżącej rzutni lub w zapisanym widoku. |
| Zakres | Drukuje wszystkie elementy na rysunku. |
| Granice | Drukuje do granic określonych na rysunku. Ta opcja jest dostępna tylko podczas drukowania w przestrzeni modelu. |
| Arkusz | Drukuje bieżący arkusz. Ta opcja jest dostępna tylko w przypadku drukowania w przestrzeni Papieru. |
| Okno | Drukuje część rysunku zawartą w oknie zdefiniowanym przez użytkownika, zachowując proporcje obszaru okna do rysunku. Kliknij przycisk Wybierz obszar drukowania ( lub Wpisz współrzędne X i Y narożników obszaru drukowania w polach X: i Y:. |
 ), a następnie określ dwa narożniki obszaru drukowania na rysunku.
Definiowanie skali wydruku
... podczas drukowania przestrzeni arkusza na papierze:
W przypadku drukowania na papierze ostateczna skala wydruku jest iloczynem skali rzutni i skali wydruku.
Aby zachować kontrolę nad skalą wydruku wykresu:
- Określa szerokość i wysokość rzutni w jednostkach rysunkowych.
- Ustaw skalę każdej rzutni na skalę, która ma być wyświetlana na wydruku.
- Skala wydruku odzwierciedla relację między jednostką papieru a jednostką rysunku. (Zobacz tabelę poniżej)
| Jednostka papieru | Jednostka rysująca | Skala druku | Wydrukowano w mm lub calach = | Jednostka rysująca |
|---|---|---|---|---|
| mm | mm | 1: 1 | 1 | 1 |
| mm | cm | 10: 1 | 10 | 1 |
| mm | m | 1000: 1 | 1000 | 1 |
| cale | cale | 1: 1 | 1 | 1 |
| cale | stopy | 12: 1 | 12 | 1 |
... podczas drukowania w obszarze modelu:
W przypadku drukowania w obszarze modelu skala wydruku jest równa skali wydruku, pod warunkiem, że jednostki rysunku są równe jednostkom papieru. W przeciwnym razie należy pomnożyć skalę działki w odniesieniu do relacji między jednostką papieru a jednostką rysunkową. Na przykład, jeśli chcesz wykreślić w skali 1/50 na rysunku, na którym 1 DU = 1 cm, skala wydruku = 1/5, jeśli 1 DU = 1 m, skala wydruku = 20/1 lub 1/0.05.
Ustawianie opcji wydruku
Kliknij, aby włączyć/wyłączyć opcje wydruku.
| Opcja | Wynik |
|---|---|
| Wyznaczanie grubości linii obiektu | Jeśli opcja Drukuj ze stylami drukowania jest wyłączona, wykreślane są grubości linii obiektów. |
| Drukuj ze stylami drukowania | Używane są ustawienia przypisanego pliku STB lub CTB. Uwaga: Dotyczy to tylko rzutni, które mają styl wizualny 2D Szkielet lub Szkielet.
|
| Przezroczystości drukowania | Wykreśla jednostki przy użyciu wartości właściwości :Przezroczystość. |
| Drukuj obszar papieru jako ostatni | Jednostki w przestrzeni modelu są wykreślane jako pierwsze, jednostki w przestrzeni papieru są wykreślane jako ostatnie. |
| Ukryj obiekty obszaru papieru | Usuwa ukryte linie z obiektów 3D w przestrzeni papieru. Ta opcja jest wyłączona podczas drukowania obszaru modelu. |
| Znaczek druku | Dodaje nagłówek i/lub stopkę. Kliknij przycisk Edytuj Znaczek druku ( |
| Zapisać zmiany w arkuszu | Wszystkie zmiany wprowadzone w oknie dialogowym Drukuj są zapisywane w arkuszu. Ta opcja przełącza zmienną Zapisz zmiany w arkuszu . |
 ), aby zdefiniować Znaczek druku.
Ustawianie trybu wykresu cieniowania
Domyślnie tryb wykresu cieniowania jest ustawiony na Jak wyświetlane.
Kliknij przycisk listy, a następnie wybierz opcję kreślenia przy użyciu innego stylu wizualnego.
Aby zdefiniować znaczek wydruku
- Kliknij przycisk Edytuj znacznik wydruku.
Zostanie wyświetlone okno dialogowe Znaczek druku.
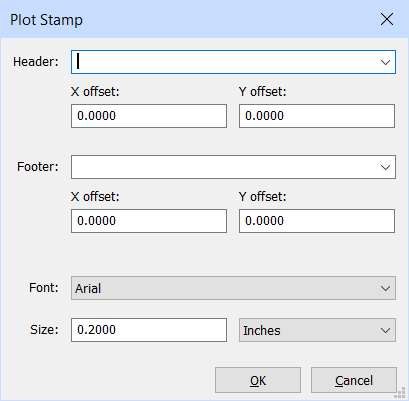
- W polu Nagłówek wykonaj jedną z poniższych czynności:
- Wpisz tekst nagłówka.
- Kliknij przycisk strzałki w dół, a następnie wybierz zmienną z rozwijanej listy.
- Wpisz jedną lub więcej nazw zmiennych (patrz tabela poniżej).
- Pozostaw to pole puste.
- Określa przesunięcie X i Y dla nagłówka.
- W polu Stopka wykonaj jedną z poniższych czynności:
- Wpisz tekst stopki.
- Kliknij przycisk strzałki w dół, a następnie wybierz zmienną z rozwijanej listy.
- Wpisz jedną lub więcej nazw zmiennych (patrz tabela poniżej).
- Pozostaw to pole puste.
- Zdefiniuj odsunięcie X i Y dla stopki.
- Wybierz czcionkę za pomocą przycisku Lista czcionek.
- Wprowadź wartość w polu Rozmiar czcionki.
- Ustaw typ jednostki na milimetry lub cale.
- Kliknij przycisk OK, aby zapisać znacznik wydruku.
| Nazwa zmiennej | Opis |
|---|---|
| $Name | Dodaje wartość przypisaną do RegisteredOwner z rejestru Windows. Uwaga: Użytkownik musi dodać nowy klucz jako String Values do rejestru Windows: Computer\HKEY_LOCAL_MACHINE\SOFTWARE\Bricsys\RegisteredOwner
|
| $Company | Dodaje wartość RegisteredOrganization z rejestru Windows. Uwaga: Użytkownik musi dodać nowy klucz jako String Values do rejestru Windows: Computer\HKEY_LOCAL_MACHINE\SOFTWARE\Bricsys\RegisteredOwner
|
| $Date | Dodaje bieżącą datę. |
| $ DateTime | Dodaje bieżącą datę i godzinę. |
| $DwgName | Dodaje nazwę pliku i ścieżkę do rysunku. |
- Tekst nagłówka i stopki składa się z trzech części (lewej, środkowej i prawej), oddzielonych przecinkami.
- Domyślnie tekst nagłówka i stopki jest wyśrodkowany.
- Tekst nagłówka i stopki składa się z trzech części (lewej, środkowej i prawej), oddzielonych przecinkami.
Na przykład:
$Name,$Company,$Dateumieszcza imię i nazwisko po lewej stronie, nazwę firmy wyśrodkowaną, a bieżącą datę po prawej stronie. - Wpisz spację przed jednym z przecinków, aby pozostawić jedną z części pustą, a tym samym obrysować nagłówek lub stopkę z lewej lub prawej strony.
Na przykład:
$Company, ,($Company,,)<space> <space>przekreśla nazwę firmy po lewej stronie., ,$Company<space><space>(,,$Company) nakreśla nazwę firmy we właściwy sposób. - Ustawienia znacznika działki są zapisywane w serii preferencji użytkownika w bieżącym profilu użytkownika, które można edytować w oknie dialogowym Ustawienia w sekcji .
Określanie liczby kopii
Wykonaj jedną z następujących czynności:
- Wpisz żądaną liczbę w polu Liczba kopii.
- Kliknij przyciski strzałki w górę i strzałki w dół, aby określić liczbę kopii.
Podgląd danych wyjściowych wykresu
Kliknij przycisk Podgląd w oknie dialogowym Drukuj lub Ustawienia strony.
Wybierz opcję Podgląd wydruku... z menu Plik.
Wpisz podgląd w wierszu poleceń, a następnie naciśnij klawisz Enter.