Exploring the interface
User interface
The BricsCAD BIM interface includes all tools, commands, and settings required to create and edit building elements. Start by creating building elements, opening an existing drawing or importing a building model.
Interface elements
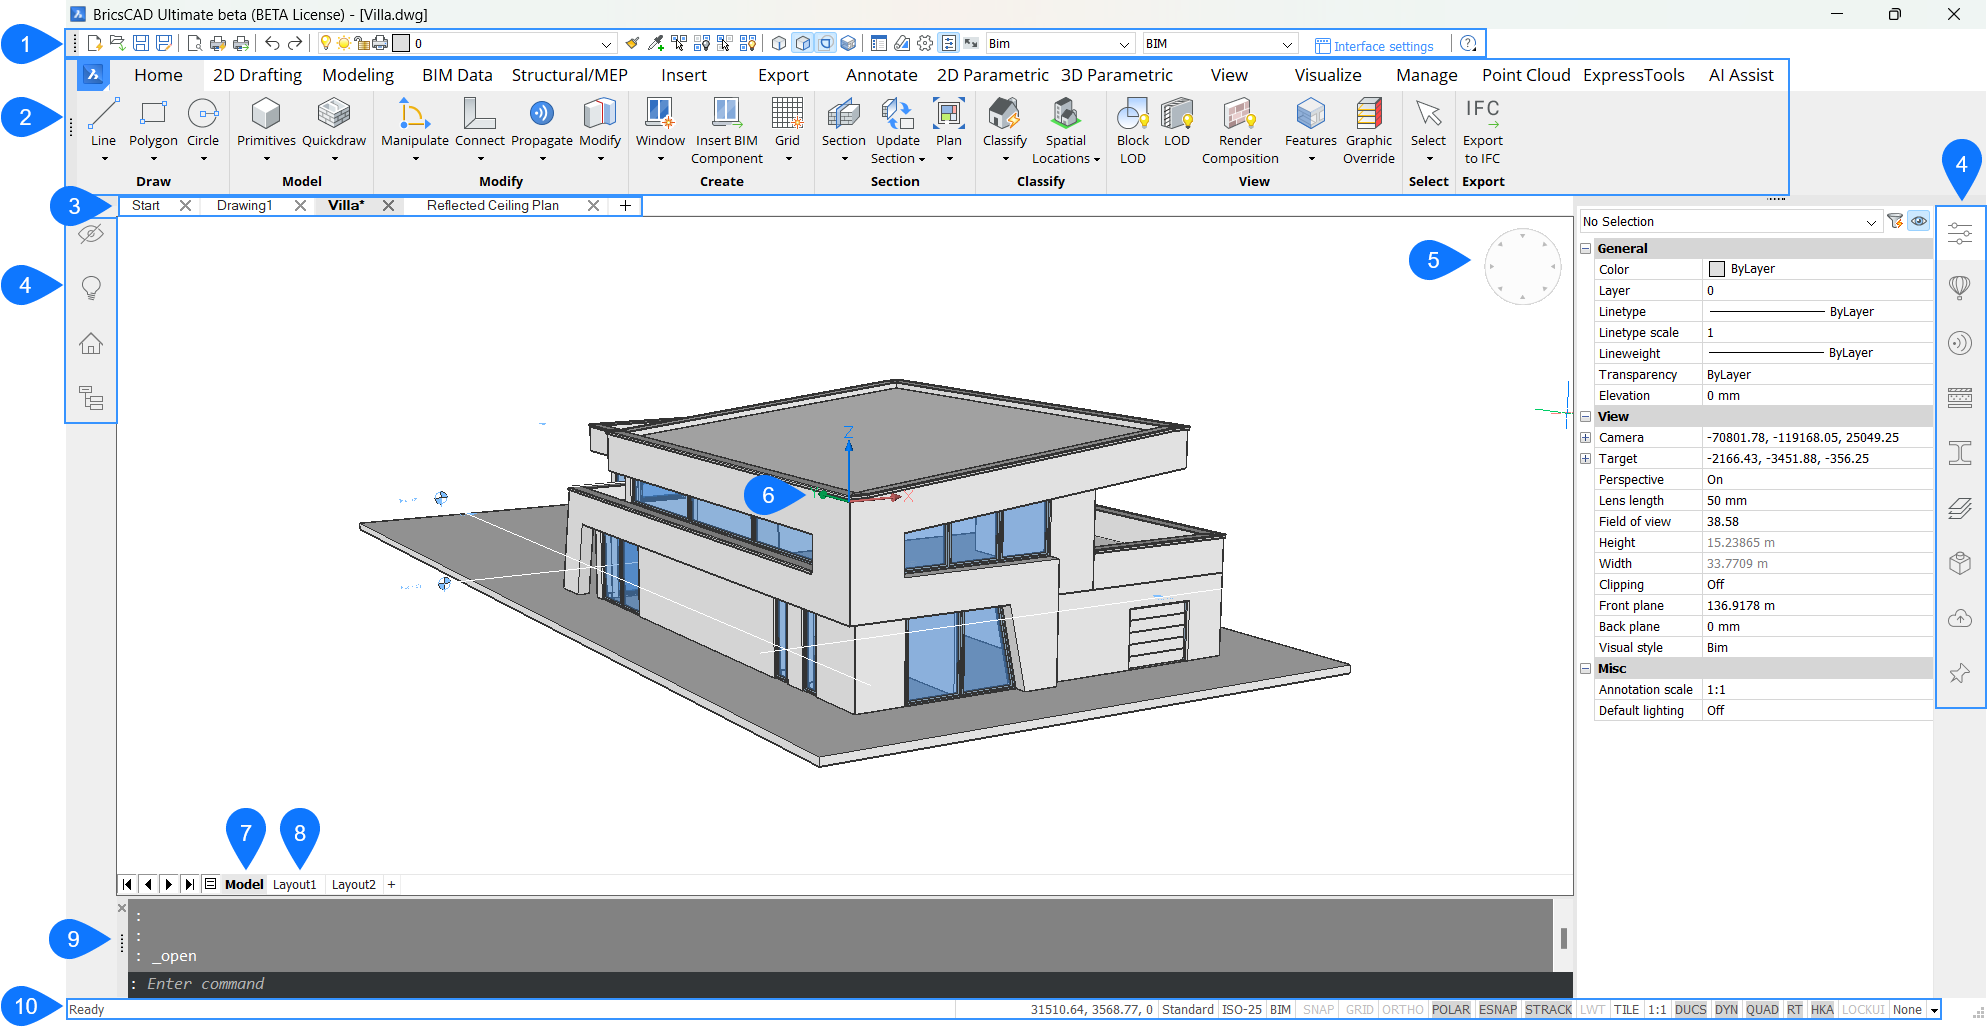
1. Toolbar
In BricsCAD, toolbars are arranged in collections of similar functions within a bar of tools. Each function is displayed with an icon and is categorized by topic. Toolbars are available for all command categories. For example, a BIM toolbar is one of the tool categories available in BricsCAD BIM. This toolbar includes the most used BIM tools for modeling. It is possible to customize existing toolbars or create your own custom toolbars.
By default, the Access3D Toolbar is shown on top of the screen.

In BricsCAD, you can easily modify the interface through the Interface Settings dialog box. Access this dialog box by clicking on the Interface Settings button.
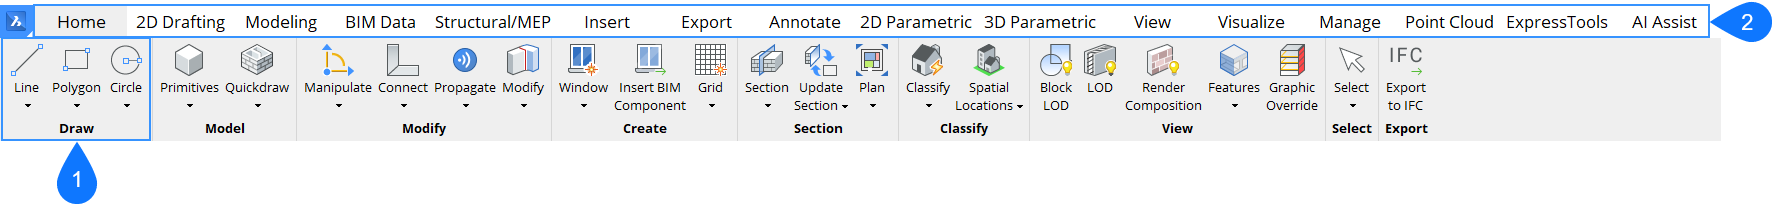
2. BIM Ribbon
A ribbon organizes tools in a series of panels (1) which are grouped in different tabs (2). Each tab contains panels and each panel contains a group of buttons and flyouts.
| Creating a ribbon tab | Open the Customize dialog box and click on the Ribbon tab. Right-click the Ribbon tabs group and choose Append ribbon tab in the context menu. 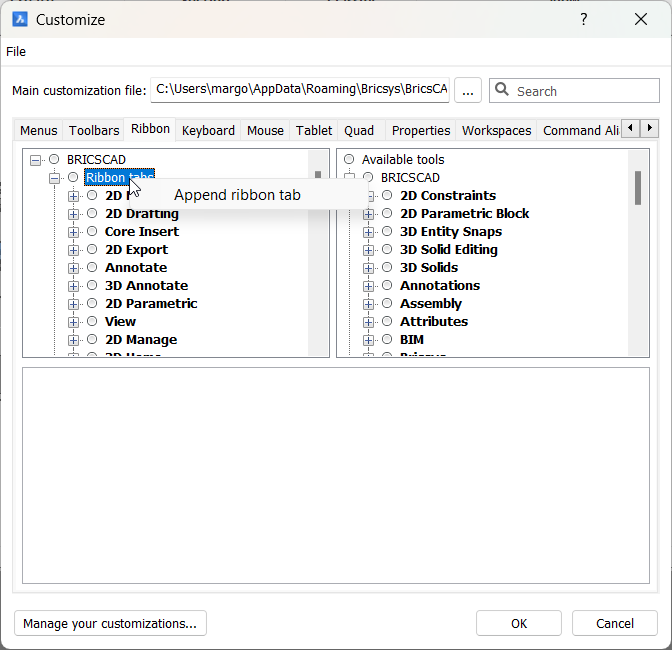 Fill out the fields in the Add Ribbon Tab dialog box: 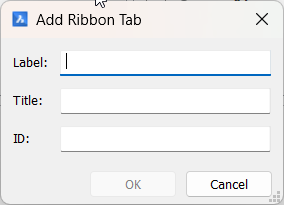 Label: Caption on the ribbon tab. Caption: Used in the Select Ribbon Tab dialog when selecting ribbon tabs for a workspace. ID: A unique name to identify the ribbon tab. |
| Editing a ribbon tab |
Open the Customize Dialog box and click on the Ribbon tab. Expand the Ribbon tabs group and you can edit each tab. |
| Creating a ribbon panel |
Open the Customize dialog box and click on the Ribbon panels. Right-click the Ribbon panels group and choose Append ribbon panel in the context menu. 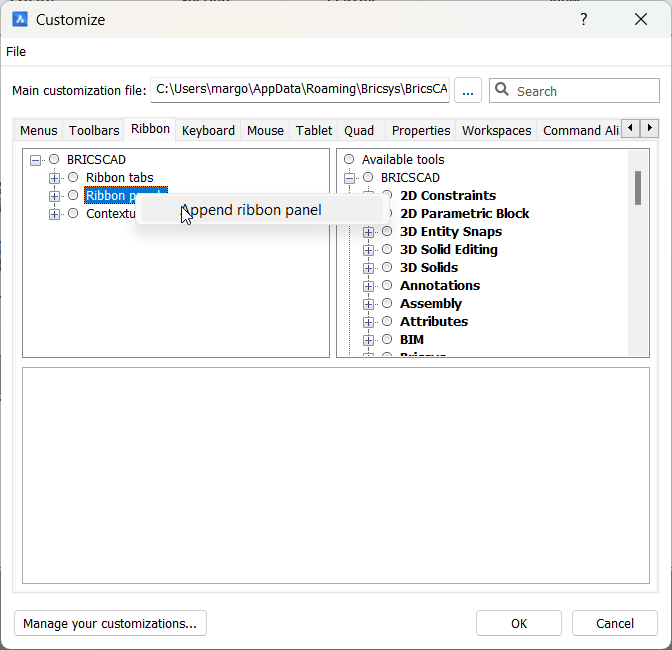 Fill out the fields in the Add Ribbon Panel dialog box:
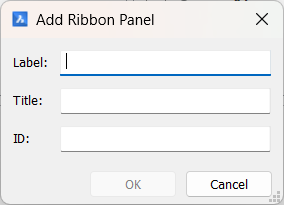 Label: Caption of the panel in the ribbon. Title: Used in the Select Ribbon Panel dialog when selecting the panels for a ribbon tab. ID: A unique name to identify the ribbon panel. |
| Editing a ribbon panel |
Open the Customize dialog box and click on the Ribbon panel. Expand the Ribbon panels group and you can edit each panel. |
3. Working with Document Tabs
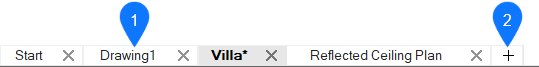
Document tabs allow you to:- Easily switch between all open drawings.
- Drag and drop the tabs to change their order.
- Click the X icon (1) at the right-hand side of the tab to close it.
- Right-click on a document tab to display a context menu.
- Click the + icon (2) at the end of the document tab to open a new drawing.
4. Tool Panel
In BricsCAD BIM the Tool panel is displayed on both sides of the workspace. The Tool panel consists of BIM panels. The BIM panels are dockable and thus they are movable. The panels can be moved to another docked panel using the drag and drop method.
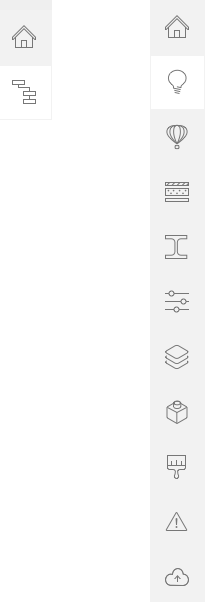
By default, the Tool panel looks like the image below: on the left-hand side it displays the Structure Browser and the Project Browser and on the right-hand side it displays Tips, Library, BIM Compositions, BIM Profiles, Properties, Layers, Mechanical Browser, Materials, Report and Bricsys 24/7.
These are the functions of the different dockable Panels from the Tool panel:
 Project Browser |
The BIM Project Browser allows you to easily navigate through the entire content of a project: models, sections, drawings, and schedules. See The BIM Project Browser article on how to use this panel. |
 Structure Browser |
The Structure Browser is an interactive tree that displays the entities in the current model. Using the configurable structure tree on the Structure Browser the BIM model can be organized in a way that you want to view the elements. Once you configured the tree, you can easily save this structured tree as a .cst file. By default, the .cst files are stored in the Support Folder. See The Structure Browser article on how to use this panel. |
 Tips |
Tips panel gives general information about the tools and commands. The tips can change depending on the active command. The tips can only be seen when the panel is open. The following illustration shows the Tips panel when the DRAG command is active:
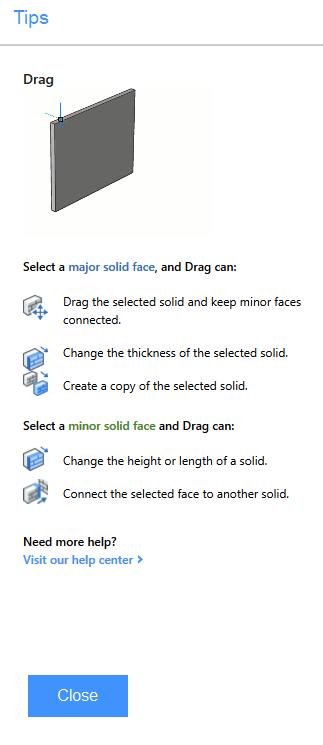 |
 Library |
The Library panel gives a list of components that you have by default. You can simply click and drag these components into your drawing. 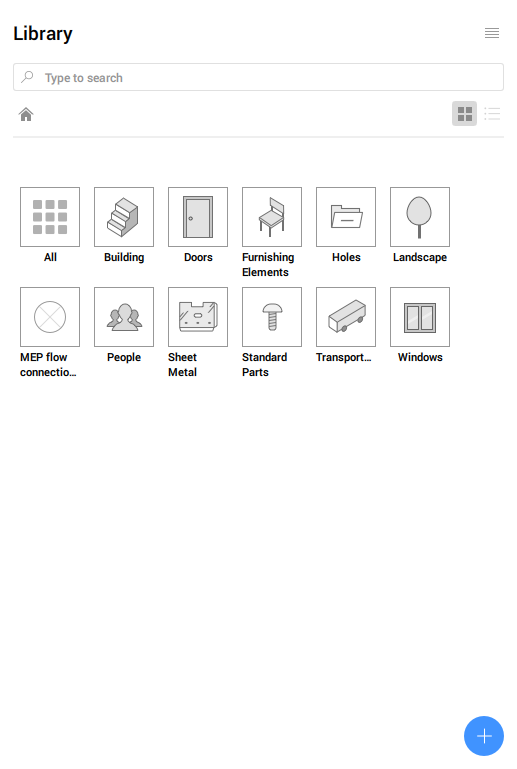 At the bottom of the panel, you have the button |

BIM Compositions |
In the BIM Compositions panel, you find a library of predefined composition that you can assign to various solids of the BIM model by dragging them on. Assigning compositions to the elements in your model is a core step to increase the BIM model accuracy. Compositions can contain either multiple materials or a single ply. See The BIM Compositions article on how to use this panel in more detail |

BIM Profiles |
The BIM Profiles panel shows a library of predefined profiles that you can assign to linear solids by dragging them on.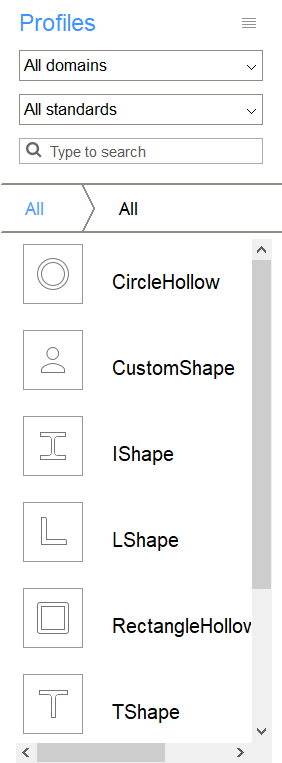
See The BIM Profiles article to see how to work with this panel in more detail. |

Properties |
The Properties panel shows all the properties of a selected element. You always have some general info first, the other different tabs within this panel depend on the type of element that is selected.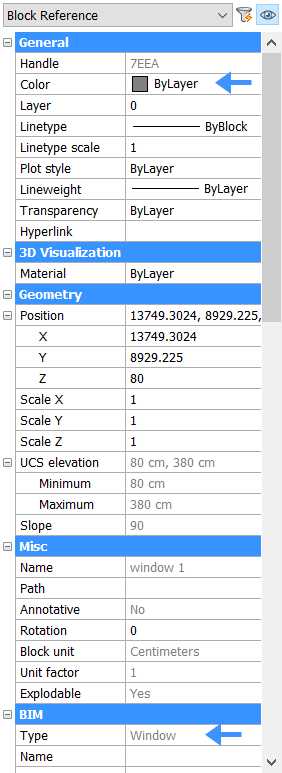
For example, here we can see that the selected item is a window and is colored by layer. You can adjust the properties as you like. See the Properties article to see how to work with this panel in more detail. |

Layers |
The Layers panel shows all the layers of your drawing. It shows you the current layer (27), you can change it by clicking left of another layer. It also shows if a layer is ON or OFF by the state its light bulb icon (28). Other layer properties such as color, linetype,... can be found and adjusted by scrolling to the right. 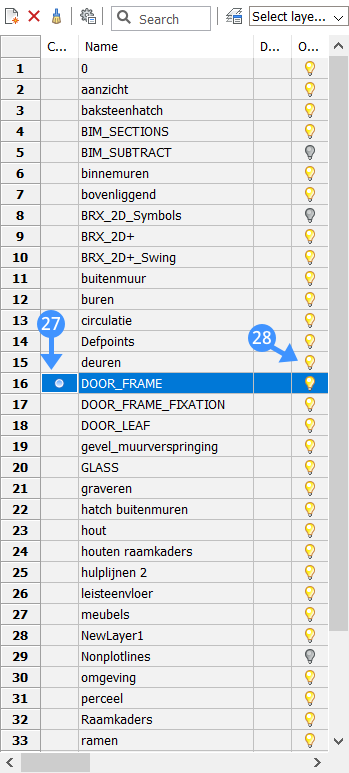
In this example the current layer is DOOR_FRAME and it is turned ON. |

Mechanical Browser |
The Mechanical Browser panel displays the hierarchy of components, features, arrays, parameters, and constraints for the current drawing. They are displayed in a tree-like form: you can expand and collapse every node to see its child nodes (for example, nested components).
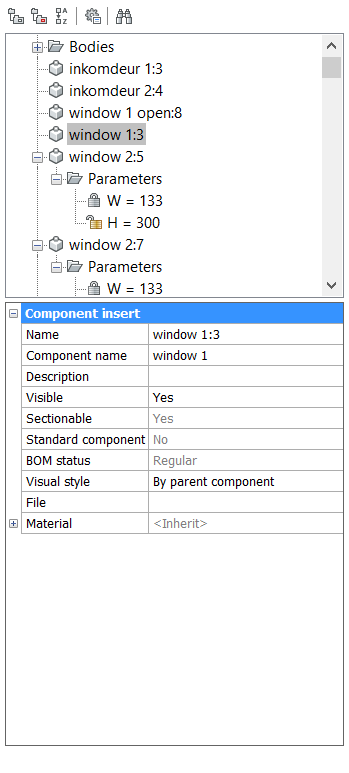
The Mechanical Browser allows you to edit properties of a particular node, displayed at the bottom of the panel and calls different tools depending on what type is available in the context menu by right click on a particular node. For example, in the image above you could add a description for the selected window. |

Render materials |
The Render materials Panel contains a library of predefined materials that you can assign to solids by dragging them on. You can also see a list of all the materials that you are currently using in your drawing. See the Materials article to see how to edit and create materials. |

Report |
Some commands use the Report panel to report the command output; e.g. all SHEETMETAL (Sm*) commands, DMAUDIT and DMSTITCH. |

Bricsys 24/7 |
Login to your Bricsys 24/7 account here to collaborate on your project in the cloud. BricsCAD 24/7 makes project management, a collaboration between project teams, cloud computing security, and task automation possible. When logged on, you can see an overview of your in the cloud Projects, Folders and Documents as shown in the image below: 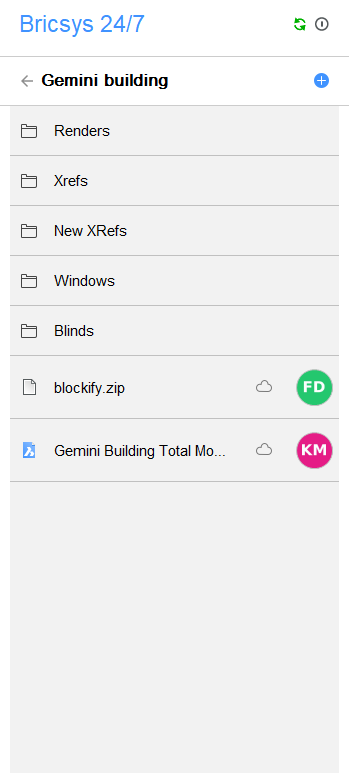
See the BricsCAD 24/7 panel article to see in detail how this panel works. |

BIM BCF |
Here you can import BCF (Bim Collaboration Format) files and connect to a BCF server. The BCF topics are listed in this panel.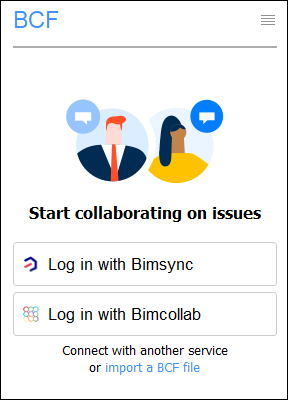
The top part of the new BCF panel shows all the topics and can look similar to the Library panel. The lower part of the new BCF panel shows the currently active topic, with a bigger snapshot and the most common metadata: comment, author, status, etc. Double-clicking on an issue activates the topic. |

Details |
In the Details panel you can:
|
 . When you have made for example a drawing of a window, you can click on this button and add your own drawing to the component library. This way your window can be used as a component in all of your other drawings.
5. Look from Widget
The Look From Widget appears in the upper right corner of the drawing area. When you hover the cursor over the widget, a small green rectangle appears (1), as does the preview of a chair (2). Clicking the cursor over one of the triangle shapes (3) shows what the 3D view will look like (4). The default location of the widget is the top right corner of the drawing area.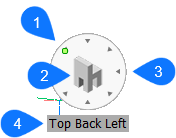
6. UCS Icon
UCS stands for a User-defined Coordinate System. The UCS icon shows the nature of the current coordinate system.The display of the icon is controlled through the UCSICON system variable and the position of the UCS icon is defined by the UCSICONPOSITION system variable.
7. Model Tab
When you start a drawing session, your initial working area is called Model Space. Model Space is an area in which you create two-dimensional and three-dimensional entities based on either the World Coordinate System (WCS) or User Coordinate System (UCS). You view and work in model space while using the Model tab.8. Layout Tab
Each drawing has at least one layout and each layout is composed of one or more viewports. Each viewport can show a different part of the drawing at a different scale.
Paper space is a work environment that provides the model space view at a given scale, depending on the size of the paper.
In each layout, you can add the entities needed to complete a printed copy of the drawing; title blocks, legends, frames, etc. These entities are only visible in the layout when you add. They are not visible in the other layouts or in the model space.
UCS in Layout Mode
In paper space of layout modes, a W letter appears in the UCS icon, which means the WCS is active.
9. Command line
- In the lower field, you can type the commands and BricsCAD shows prompt, options and other information regarding the execution of commands here. If the Command line is closed, this information shows in the Status Bar.
- The command history displays in the upper field of the Command line.
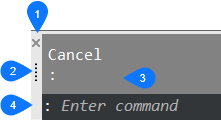
| Close (1) | Click to close the Command line. |
| Grip (2) | Press and hold the left mouse button to drag the command bar. |
| Command history (3) | Shows the previously typed commands. |
| Command edit (4) | Type the commands and command options here. |
10. Status Bar
The Status Bar sits along the bottom edge of the BricsCAD application window. It contains a lot of information about the settings in the current drawing. All fields in the Status Bar are optional, except for the Status field (1). If you click the small down arrow button at the right end of the status bar (2) a list of all field displays. Click a field to toggle its display.

| Status field (1) | Displays the status of the software. |
| List button (2) | Click the arrow to display a list of available Status Bar fields. |
| Fields (3) | Click a field to toggle it ON/OFF. Right-click to display a context menu. |