General procedure for printing
The PLOT and PRINT commands plot drawings to printers and to files, through the Print dialog box.
The -PLOT command plots drawings to printers and to files, through prompts at the command bar; this command is meant for scripts and routines.
The QPRINT command prints the drawing with the default plot configuration, without displaying the Print dialog box.
The PAGESETUP command creates and edits page setups for plotting drawings in the Drawing Explorer dialog box.
A standard print procedure consists of the following steps:
- Choose either a Layout tab or the Model tab.
- Open the Print dialog box.
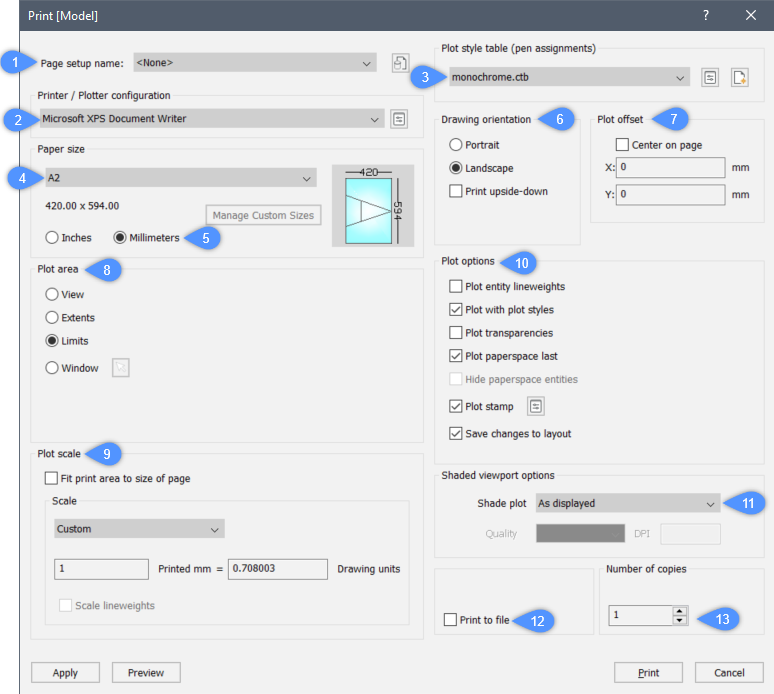
- Select a Page Setup name. (1)
The following steps are optional and only necessary if you want to use overrides on the selected page setup definition.
- Choose a Printer or Plotter configuration. (2)
- Choose a Plot style table. (3)
- Choose a Paper size. (4)
The image reflects the position and orientation of the drawing on the selected paper size.
- Choose the paper size unit. (5)
- Choose the Drawing orientation.(6)
- Define the Plot offset. (7)
- Specify the Plot area (the area to plot). (8)
- Define the Plot scale. (9)
- Check the Plot options. (10)
- When printing model space, choose a Shade plot mode. (11)
This option is disabled when printing a paper space layout.
- Check/uncheck the Print to file option. (12)
- Specify the Number of copies. (13)
- Click the Preview button to see a preview of the plot output.
- When in a layout, click the Apply button to update the layout.
- Click the Print button to start printing.

- On macOS and Linux it is not possible to print to system printers. It is only possible to print to the Print As PDF.pc3 printer. So, a PDF document will be generated, which needs to be sent to the printer for physical printing.
- On macOS and Linux there is a relevant PAGESETUP command.
Opening the Print dialog box

Do one of the following:
- Launch the PRINT or PLOT command.
- Press Ctrl + P.
- Choose Print... in the File menu.
- Click the Print tool in the Output / Plot ribbon panel (Drafting workspace).
- Select the Model tab or a Layout tab, then right-click and choose Print in the context menu.
Choosing the paper size
Press the down arrow, then select the paper size in the Paper Size list.
The available sizes depend on the selected printer.
Choosing the paper unit
Select either Inches or Millimeters.

The paper size image indicates the size, position and orientation of the plot area on the selected paper size.
Choosing the paper orientation
Select either Portrait or Landscape.
- Portrait: The drawing or layout x-axis is aligned with the shortest edge of the selected paper size.
- Landscape: The drawing or layout x-axis is aligned with the longest edge of the selected paper size.
The paper size image changes accordingly.
When in a layout, click the Apply button to update the display.
Defining the plot offset
Select either Center on page or type the plot offset in the X: and Y: fields.
The offset is calculated from the bottom left corner of the paper.
When in a layout, click the Apply button to update the display.
To specify the plot area:
| Option | Result |
|---|---|
| View | Prints the portion of the drawing that is displayed in the current viewport or a saved view. |
| Extents | Prints all entities in the drawing. |
| Limits | Prints to the limits defined in the drawing. This option is only available when printing in Model space. |
| Layout | Prints the current layout. This option is only available when printing in Paper space. |
| Window | Prints the portion of the drawing contained in a user defined window, maintaining the aspect ratio of the windowed area to the drawing. Click the Select print area button ( or Type the X- and Y-coordinates of the corners of the print area in the X: and Y: fields. |
Defining the plot scale
... when printing a paper space layout:
If you print in paper space, the final scale of the plot output is the product of the viewport scale and the plot scale.
In order to keep control over the scale of the plot output:
- Specify the width and height of the viewports in drawing unit.
- Set the scale of each viewport to the scale you want in the plot output.
- The plot scale reflects the relationship between paper unit and drawing unit. (see table below)
| Paper unit | Drawing unit | Plot scale | Printed mm or inches = | Drawing unit |
|---|---|---|---|---|
| mm | mm | 1:1 | 1 | 1 |
| mm | cm | 10:1 | 10 | 1 |
| mm | m | 1000:1 | 1000 | 1 |
| inches | inches | 1:1 | 1 | 1 |
| inches | feet | 12:1 | 12 | 1 |
... when printing model space:
If you print in model space, the scale of the plot output equals the plot scale, on the condition that your drawing unit matches the paper unit. Otherwise you need to multiply the plot scale with respect to the relationship between the paper unit and the drawing unit. E.g. if you want to plot at a 1/50 scale in a drawing of which 1 DU = 1 cm, the plot scale = 1/5, if 1 DU = 1 m the plot scale = 20/1 or 1/0.05
Setting the plot options
Click to toggle the plot options On / Off.
| Option | Result |
|---|---|
| Plot object lineweights | If Plot with plot styles is off, object lineweights are plotted. |
| Plot with plot styles | Settings of the assigned STB or CTB file are used. Note: This applies to viewports which have the 2D Wireframe or Wireframe visual style only.
|
| Plot transparencies | Plots entities using the value of the Transparency property. |
| Plot paperspace last | Entities in Model space are plotted first, paperspace entities are plotted last. |
| Hide paperspace entities | Removes hidden lines from 3D entities in paper space. This option is disabled when printing model space. |
| Plot stamp | Adds a header and / or footer. Click the Edit plot stamp button ( |
| Save changes to layout | All changes made in the Print dialog are saved in the layout. This option toggles the Save changes to layout variable. |
Setting the shade plot mode
By default the Shade Plot mode is set to As displayed.
Click the list button, then select an option to plot using a different visual style.
Defining the plot stamp
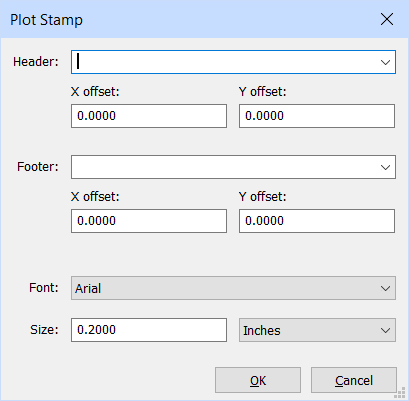
- Click the Edit plot stamp button.
The Plot stamp dialog box appears.

- In the Header field, do one of the following:
- Type the header text.
- Click the down arrow button, then choose a variable in the drop down list.
- Type one or more variable names (see table below).
- Leave the field empty.
- Define the X and Y offset for the header.
- In the Footer field, do one of the following:
- Type the footer text.
- Click the down arrow button, then choose a variable in the drop down list.
- Type one or more variable names (see table below).
- Leave the field empty.
- Define the X and Y offset for the footer.
- Select a font in the Font list button.
- Enter a value in the Font Size field.
- Set the unit type to Millimeters or Inches.
- Click the OK button to save the plot stamp.
| Variable Name | Description |
|---|---|
| $Name | Adds the value assigned to the RegisteredOwner from the Windows registry. Note: User must add the new key as String Values into Windows registry: Computer\HKEY_LOCAL_MACHINE\SOFTWARE\Bricsys\RegisteredOwner
|
| $Company | Adds the value of the RegisteredOrganization from the Windows registry. Note: User must add the new key as String Values into Windows registry: Computer\HKEY_LOCAL_MACHINE\SOFTWARE\Bricsys\RegisteredOwner
|
| $Date | Adds the current date. |
| $DateTime | Adds the current date and time. |
| $DwgName | Adds the file name and path of the drawing. |
- The header and footer text consists of three parts (left, center and right), separated by commas.
- By default, the header and footer text is centered.
- The header and footer text can be outlined left center and/or right by separating the text with commas.
e.g. $Name,$Company,$Date places your name left, company name centered and the current date at the right.
- Type a space before one of the commas to leave one of the parts empty, thus outlining the header or footer left or right.
e.g. $Company, , ($Company,<space>,<space>) outlines the company name left. , ,$Company (<space>,<space>,$Company) outlines the company name right.
- The plot stamp settings are saved to a series of user preferences in the current user profile, which can be edited in the Settings dialog box under .
Specifying the number of copies
Do one of the following:
- Type the desired number in the Number of copies field.
- Click the up-arrow and the down-arrow buttons to specify the number of copies.
Previewing the plot output
Click the Preview button on the Print or Page Setup dialog box.
Choose Print Preview... in the File menu.
Type preview in the Command line, then press Enter.


 ), then specify the two corners of the print area in the drawing.
 ) to define the plot stamp.