POINTCLOUDBUBBLEVIEWER command
Opens the Bubble viewer.

Description
Opens the Bubble viewer for the point cloud bubble with the associated specified index. The name of the selected bubble (active scan) is displayed in the title bar of the viewer.
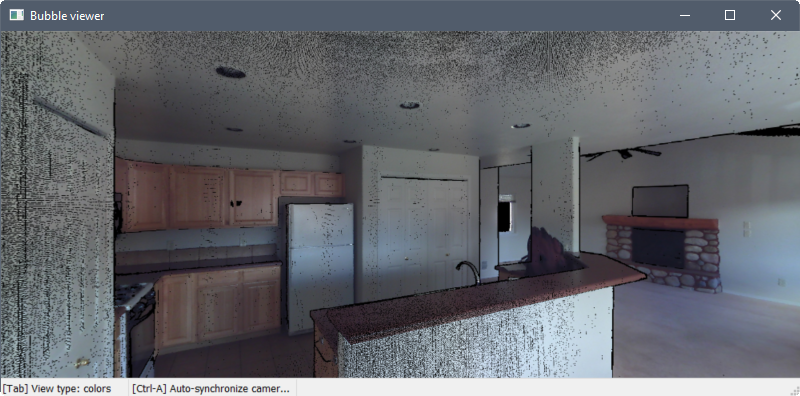
Bubble Viewer
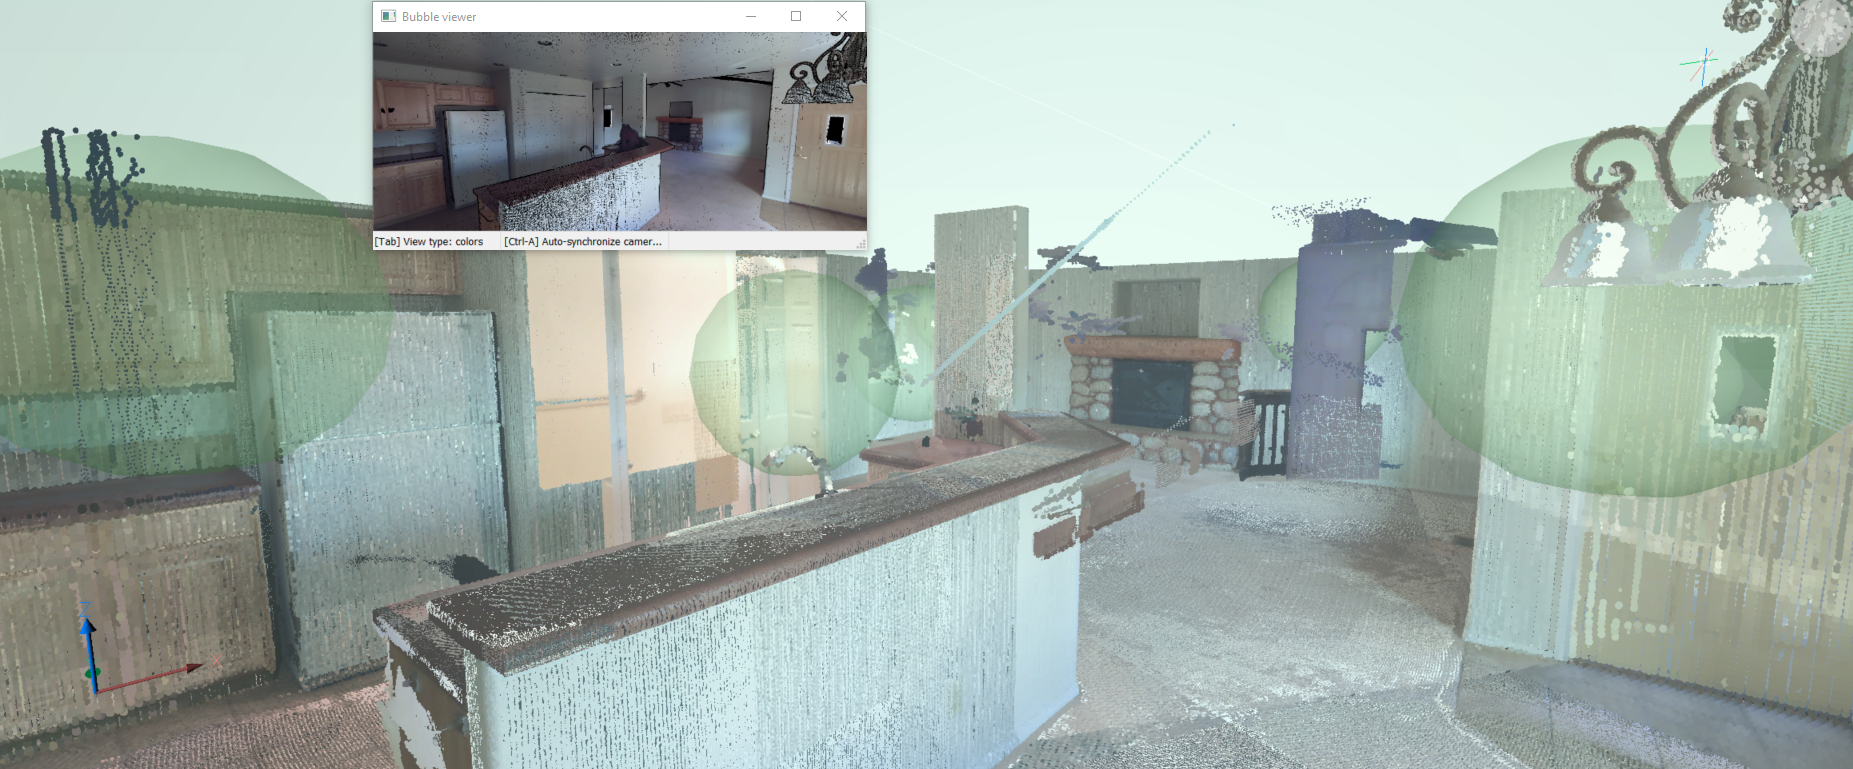
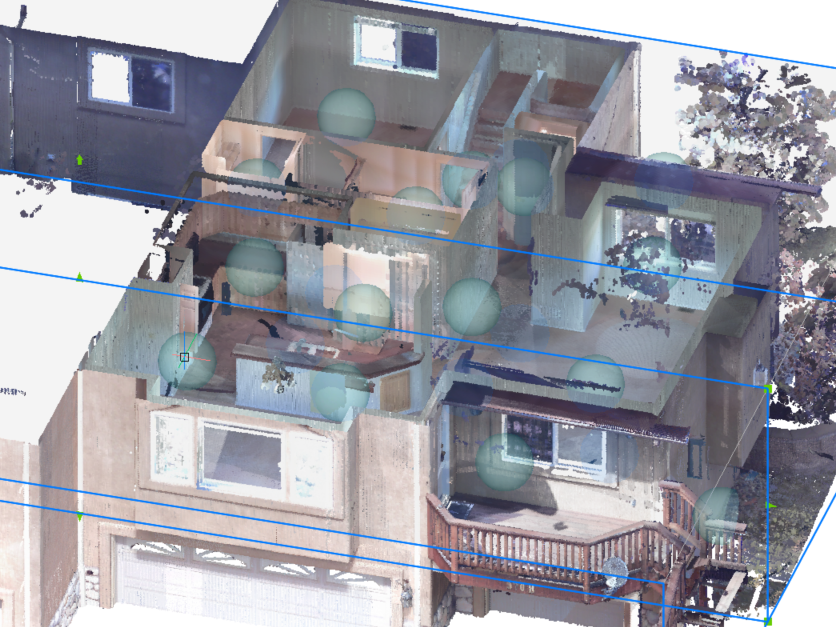
Depending on the original file format of the point cloud and the type of scanner used during scanning (static or kinematic), bubbles (green spheres) or waypoints (blue spheres) might be shown at all the scan locations. At these locations, you can experience the most realistic visual representations by opening the Bubble viewer.
To open the Bubble viewer:
- Run the POINTCLOUDBUBBLEVIEWER command.
- Select the Open scan in bubble viewer option from the context menu of scan or waypoint listed in the Point Cloud Manager panel's Scans or Waypoints lists.
Structured data is captured using a static scanner. In this case the location of the scanner is known for every point. Green bubbles are created at the locations of the static scanner from the scanned points.
Unstructured data is captured using a kinematic scanner. In this case there is no exact location from where the points were scanned. Some of the kinematic scanners create panoramic images at time intervals. For these images the location is known and waypoints (blue spheres) are created.
Indicate a bubble index in the POINTCLOUDBUBBLEVIEWER command or double-click one of the bubbles in the model space to open the Bubble viewer.
Press and hold the middle mouse button and move the mouse to view the point cloud in any direction from that scan location.
Zoom in and out using the mouse wheel.
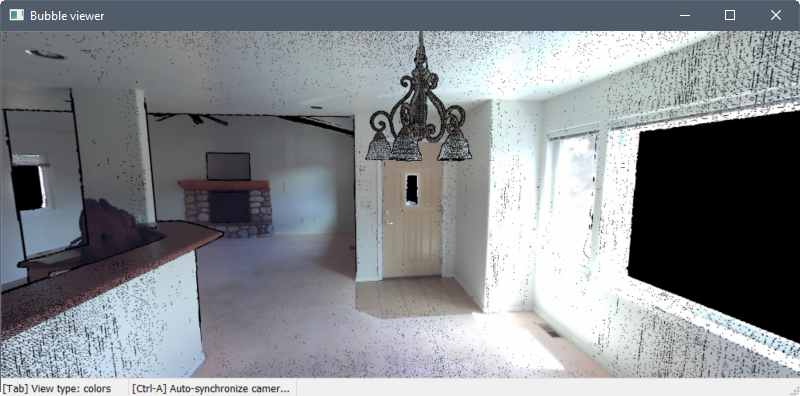
Nearby scans are indicated in the Bubble viewer by red bubbles. Hover the cursor over a bubble to display the scan name. Double-click a bubble to open the scan in the viewer.
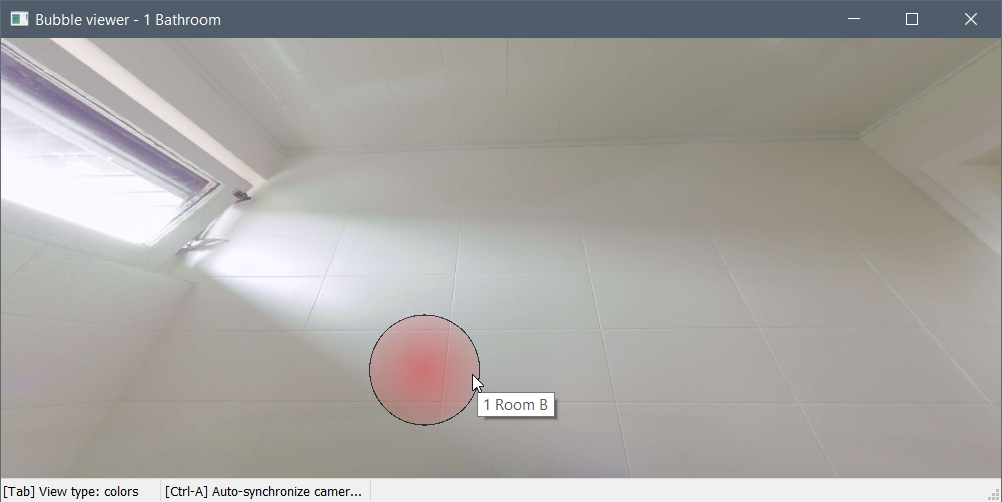
Press the Tab key to cycle through three different visual modes (view types).
-
The colors and colors (depth) modes display the points as their actual colors or in grayscale, depending on how the data was scanned.
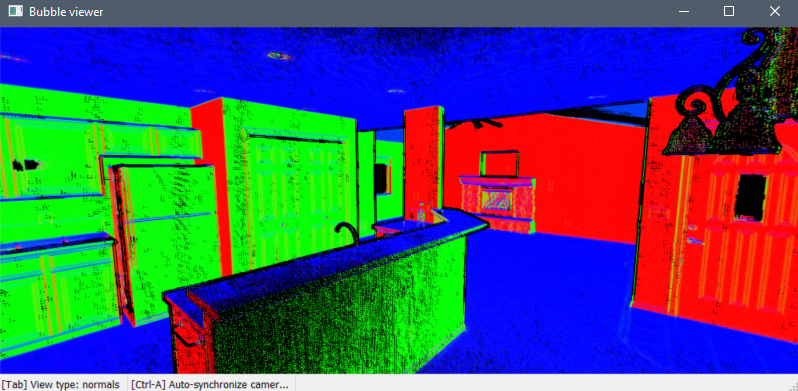
-
The normals mode displays the points as red, green, or blue according to their normal vectors. The colors correspond to the UCS axes.
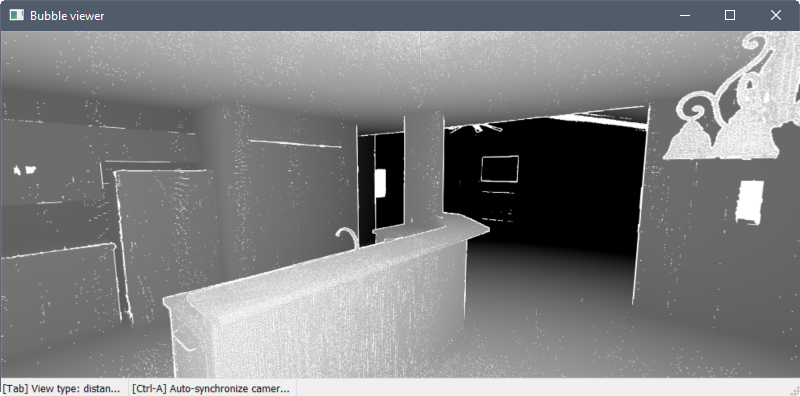
-
The distances mode displays the points from light to dark as the distance from the scan location increases.
Sync the drawing view to match the Bubble viewer by pressing Ctrl+A.